Google Grant Fuels Growth of Historic New Orleans Organization

Digital Advertising

The Challenge: Starting From Scratch on a Budget

The Historic New Orleans Collection set a goal of boosting visitation by 15%, aiming to hit 70,000 annual visits in 2025 — but when we began working with them, there was no recent campaign data or performance history in the account to build on, and we had to start fresh with a limited budget.

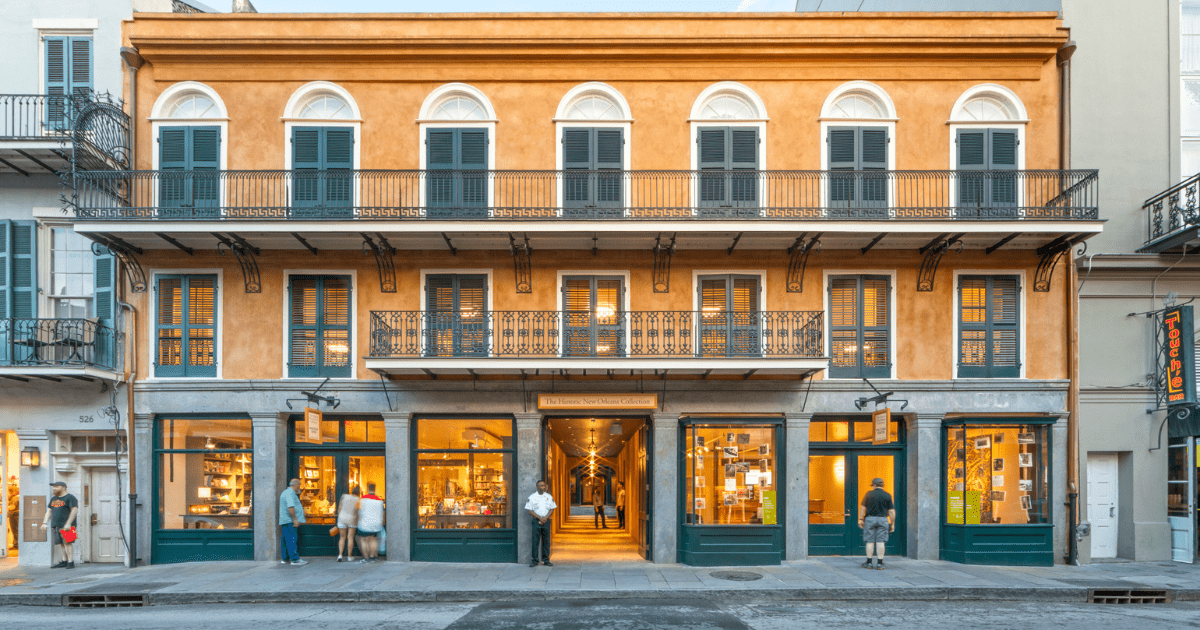
The exterior of the Historic New Orleans Collection building

The Strategy: Making Google Grants Work Smarter

We started by isolating the brand campaign in their regular Google Ads account, alongside two additional campaigns: a local campaign local campaign targeting a radius of 5, 10, 15, and 25 miles around 520 Royal St in New Orleans, and a national campaign targeting users across all 50 U.S. states and Washington, D.C. Through this, we identified that the brand campaign had the highest quality score and the lowest cost per click.

After reviewing the data, we identified the brand campaign as the primary driver of their spend – and met Google Grant program requirements – we migrated the brand campaign into a Google Ads Grant account, which offers up to $10,000 per month in free ad spend for eligible nonprofits. This allowed us to capture high-intent branded traffic for free.*

The campaign’s structure was designed to achieve four main goals:

  1. Provide segmented, easy-to-read insights
  2. Allow our agency to communicate optimizations clearly with the client
  3. Free up paid media budget for upper-funnel efforts
  4. Deliver weekly recommendations that translated into results

Due to this well-segmented setup, we were able to redistribute traffic in a way that the top-performing brand campaign no longer cost the client anything out of pocket.

*Note: This approach doesn’t work with just any set of keywords. Later in the process, we added upper-funnel keywords to the account, but without an existing demand behind them, we didn’t see the same results.

Results

Once the grant account was live and we moved brand traffic over about four weeks into the campaign, we quickly saw performance lift in a variety of ways. Here’s what we were able to achieve since launching until the end of October:

Growth
in brand awareness and site activity, supporting our other paid campaigns
$0.00
saved in ad spend
0
conversions secured at no cost
0
Page Visits
0
Add-To-Cart
0
Purchases
0
Form Submissions

Even more impressive – this growth came during the museum’s slower season, with June and July historically being their lowest-traffic months.

Between May 20 and September 1 (weeks 21–34), visitation increased by 1,921 visits year over year – from 13,492 in 2024 to 15,413 in 2025 – marking a +14.24% lift.

Zooming out further, between March 25 and October 31 (weeks 13–43), visitation increased by 3,825 visits year over year – from 34,420 in 2024 to 38,245 in 2025 – marking a 11.11% lift.

Impression Share vs CTR Chart V2

From the Client

No results found.

Similar Case Studies

Be Our Next Case Study!